Observe and improve
Tower's observability features help you monitor the health of your data system, quickly identify issues, and take targeted action where needed. This guide explains how to use Tower's observability tools to maintain optimal performance.
Understanding system health
In Tower, you can assess the health of your data system by observing your apps and understanding which of them are healthy or need attention.
Tower uses a simple status model to help you quickly assess system health.
| App Status | Meaning | Action Required |
|---|---|---|
| Running | Run in progress | None - normal operation |
| Successful | Latest run completed without errors | None - normal operation |
| Failed | Latest run encountered errors | Investigate and fix |
| Disabled | App manually deactivated (coming soon) | None - intended state |
Except for the Running and Disabled app statuses, the remaining two app statuses - Successful and Failed - are based on the statuses of the last completed run.
| Last Run Status | Resulting App Status | Description |
|---|---|---|
| Exited | Successful | Last Run completed successfully |
| Scheduled | Successful | A new Run is planned for future execution |
| Errored | Failed | Last Run failed due to system-level issues |
| Crashed | Failed | Last Run failed due to issues in user code |
Monitoring system health in the Tower UI
The Tower Home Page serves as your observability dashboard, providing multiple ways to assess system health.
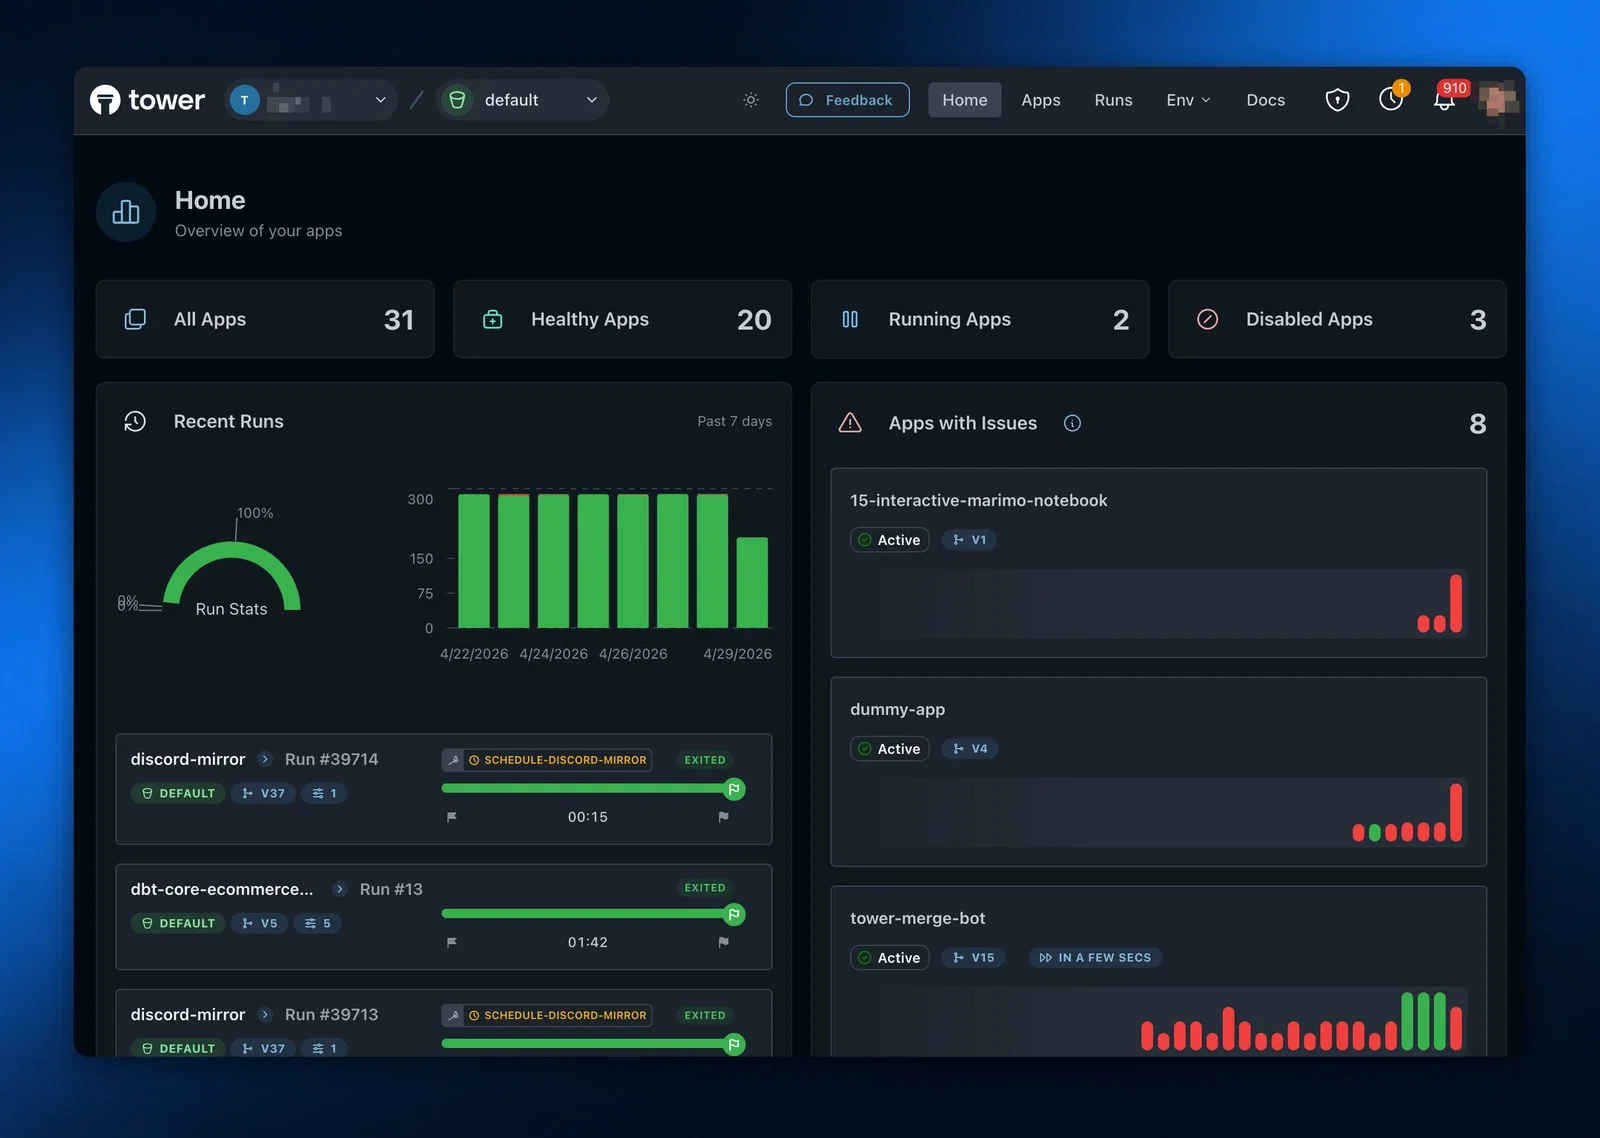
The Home Page includes:
-
App Statistics - Shows the overall statistics of your team.
-
Run History Chart - Displays successfully exited vs. errored/crashed runs over time, helping you spot trends or sudden increases in failures.
-
Apps With Issues - Shows all active apps that have at least 2 failed or crashed runs within their last 10 runs, helping you quickly spot recurring problems.
Using the CLI to monitor system health
In addition to observability capabilities in the Tower UI, Tower also provides them in the CLI.
Coming soon
Finding apps that need attention
To identify and fix problematic apps:
- Click the "Failed" app status in the App Status Summary to filter the list to only failed apps
- Select a specific date range from the dropdown in the Run History Chart to focus on recent failures
- Click any app card to view detailed run information
Setting up automatic alerting
Tower provides configurable alerting capabilities to keep you informed about your apps' status and any potential issues.
Alert Channels
Tower offers two notification channels to keep you informed:
-
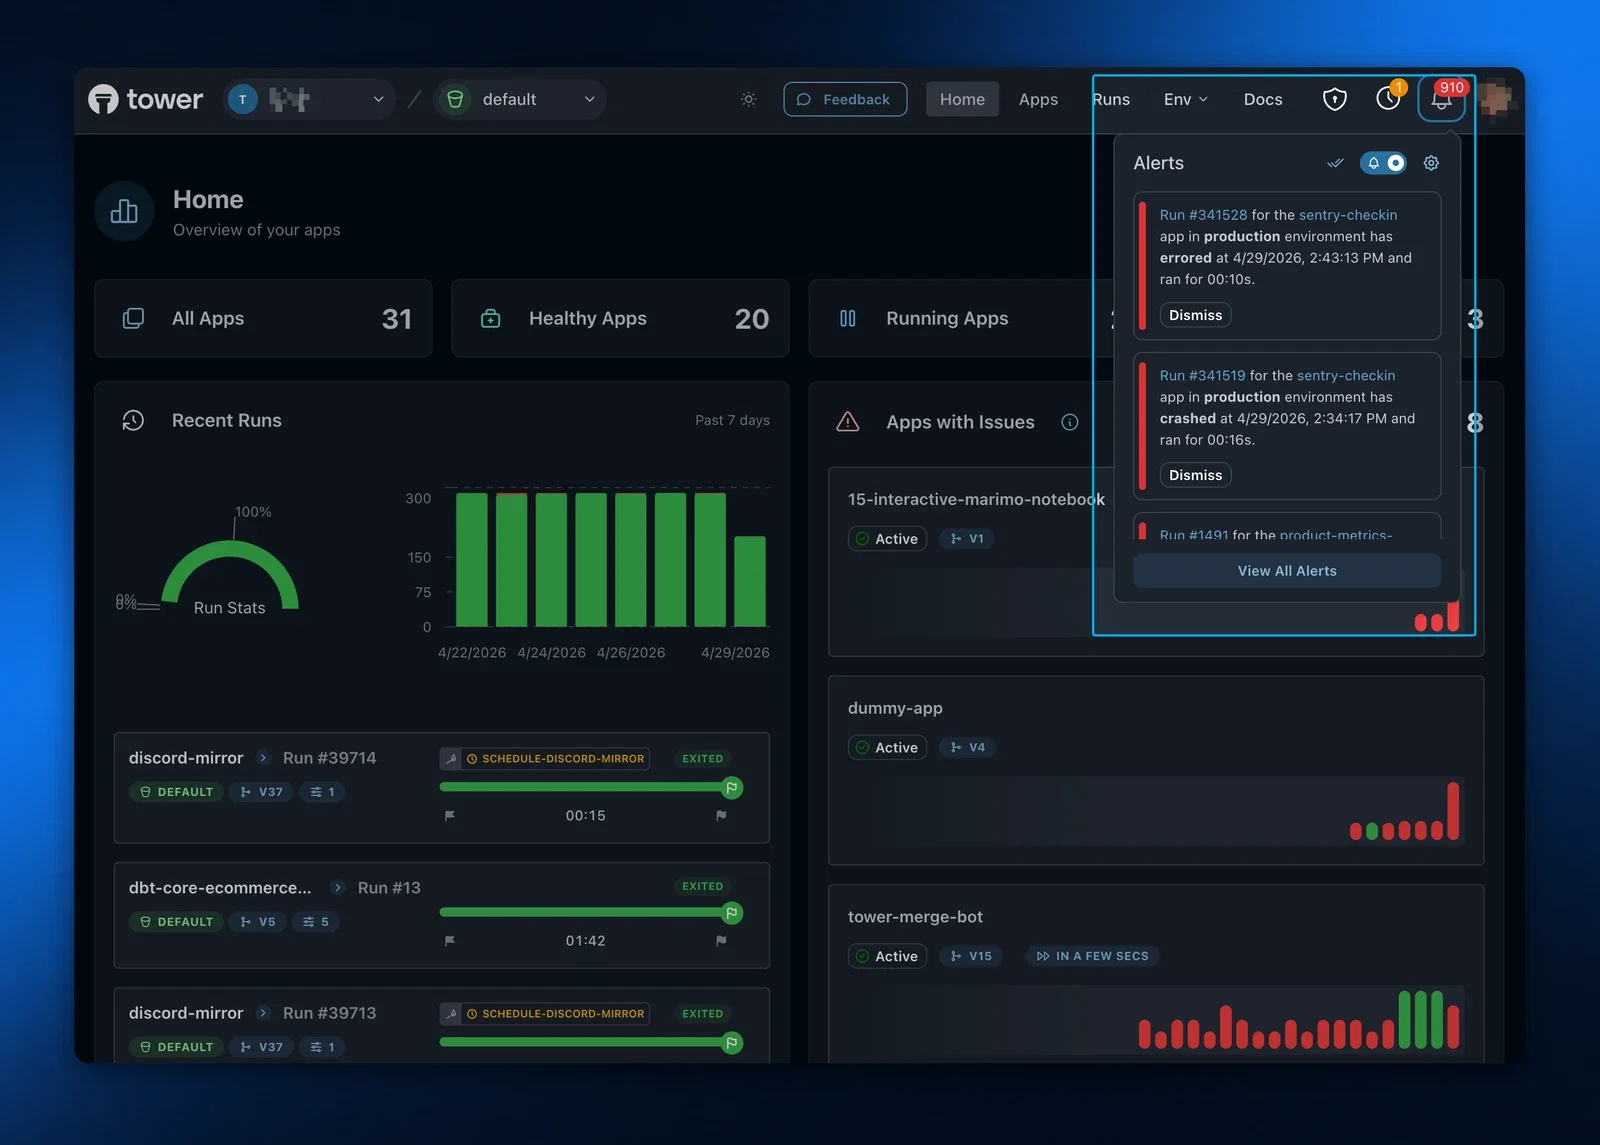
In-app notifications: An alert bell icon in the Tower UI displays the count of unacknowledged alerts. This provides immediate visibility into issues requiring your attention.
-
Email notifications: Tower automatically sends email notifications when app runs fail, ensuring you're promptly informed of issues even when away from the UI.
Alert Conditions
Tower triggers alerts when an app run enters one of the Failed states, specifically when it exits in Crashed or Errored states. This helps you quickly identify and address issues that require intervention.
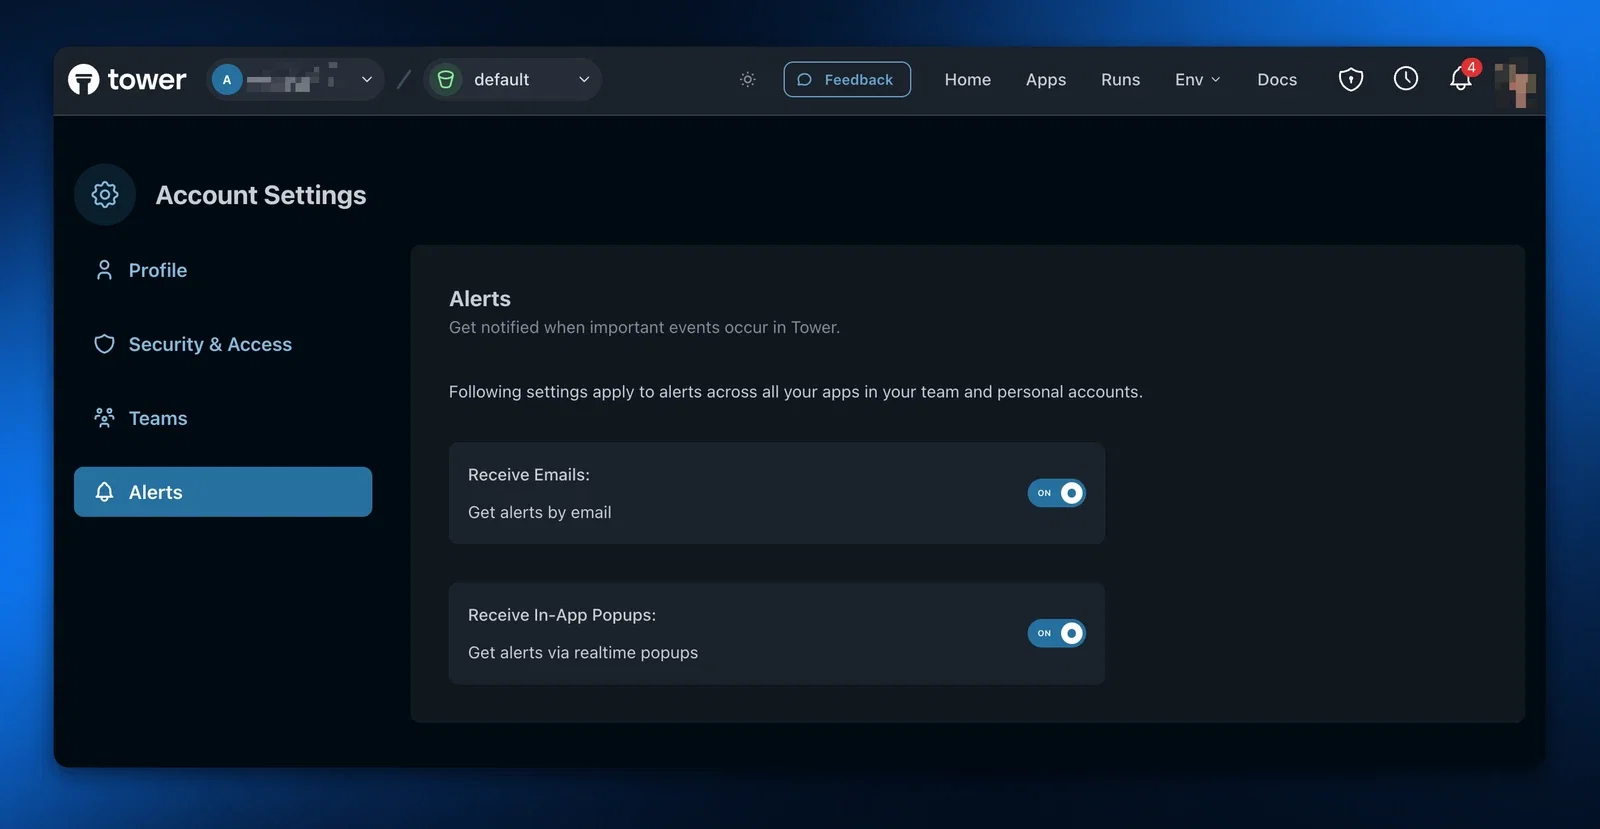
Managing Alert Settings
You can customize your alert preferences through the Alerts interface under Account Settings, where you can enable or disable notifications based on your needs.
Investigating and fixing issues
When you identify a failed app:
-
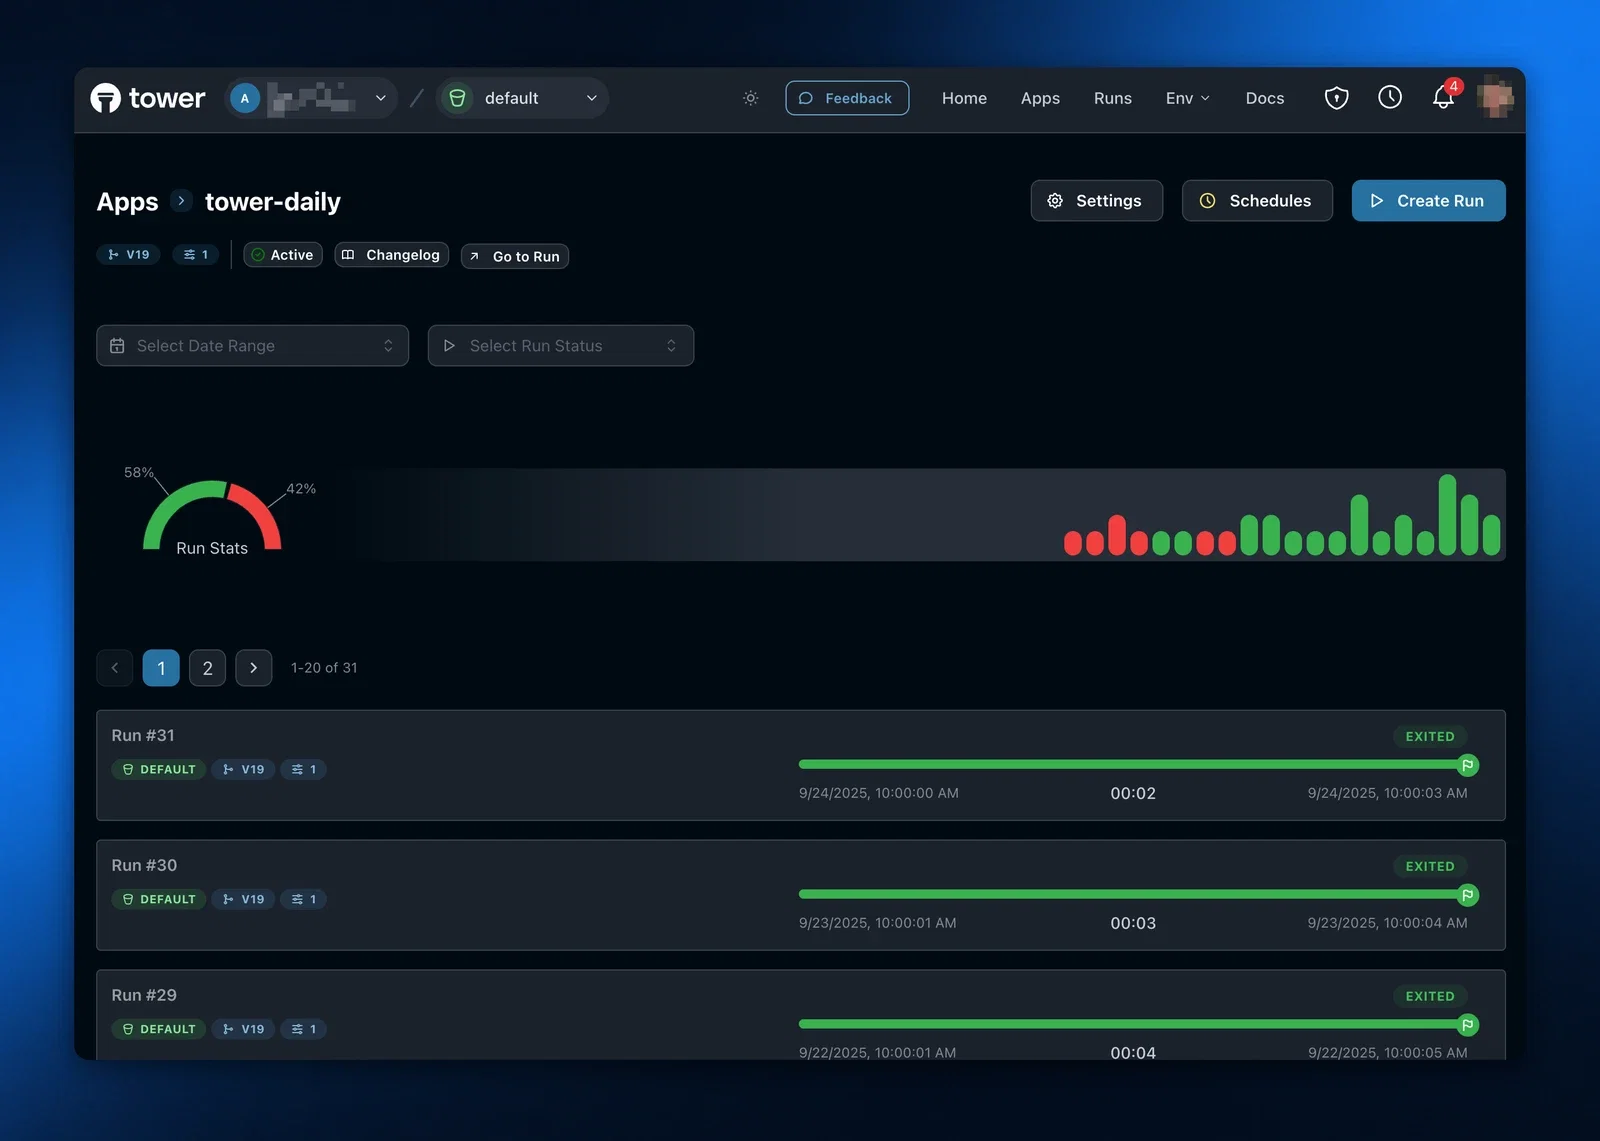
Navigate to the App Details page by clicking the app card
-
Review the list of runs, focusing on the most recent failed run
-
Click on the failed run to open the Run Details page
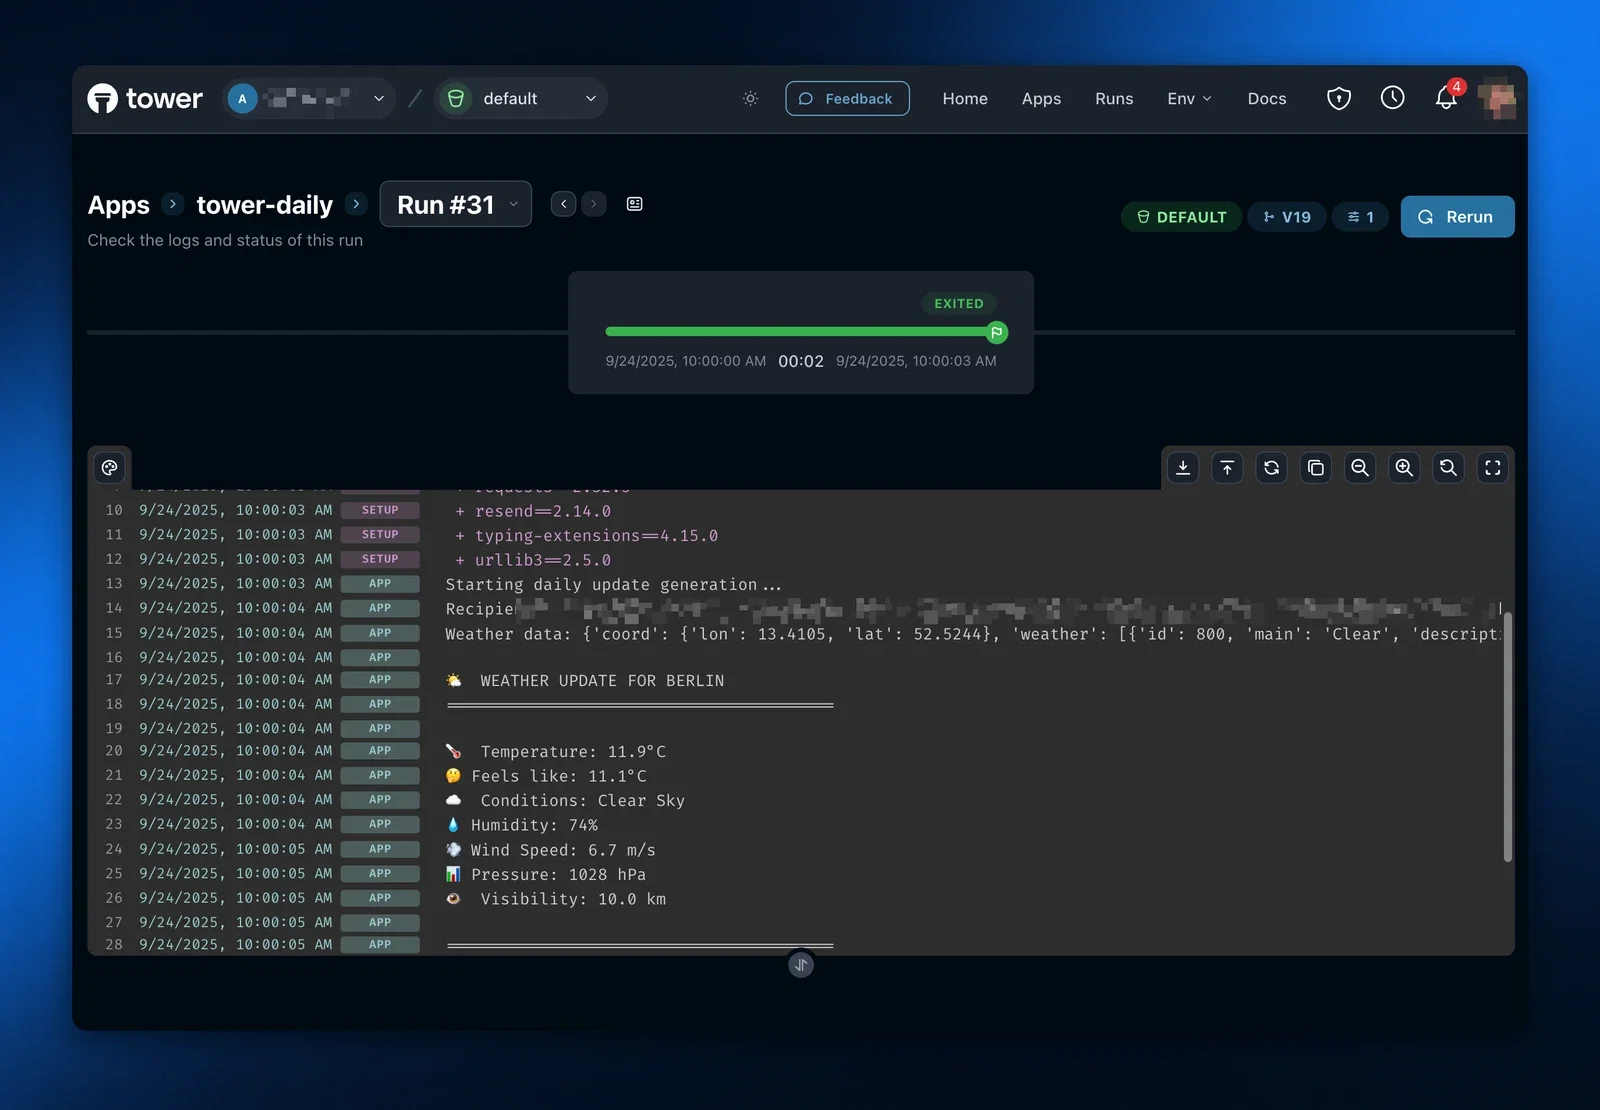
-
Analyze the logs to identify the specific error:
- For Crashed runs: Focus on user code-level exceptions, input data issues, or configuration problems
- For Errored runs: Note the error and contact Tower administrators if it appears to be a platform issue
Common Issues and Solutions
| Issue Type | Common Signs | Typical Solutions |
|---|---|---|
| Data format changes | Schema validation errors | Update code to handle new formats |
| Resource limits | Memory/CPU errors | Optimize code or request increased resources |
| Authentication | Permission denied errors | Update or rotate credentials |
| System dependencies | Import or library errors | Update dependencies or contact admin |
After making code changes, test locally using the guidance in our Test guide before redeploying the app to Tower.